Author: James Brimer (Associate Security Researcher)
Purpose Outline
This document presents a comprehensive analysis of the cybersecurity threats posed by QR codes embedded within digital files. It aims to:
• Highlight the methods by which threat actors exploit QR codes in various file formats.
• Discuss the limitations of traditional security measures in detecting and mitigating QR code-based threats.
• Introduce Glasswall’s Content Disarm and Reconstruction (CDR) technology as a proactive solution to neutralize these threats.
• Provide a statistical evaluation of existing QR code detection methods and their effectiveness.
• Demonstrate practical mitigation techniques for removing malicious QR codes from digital files.
Summary
QR codes are now a common part of digital communication, but they also present a growing cybersecurity risk. Threat actors are increasingly embedding malicious payloads, like phishing links and malware, into QR codes found in everyday documents like PDFs and images. These threats often go undetected by traditional tools like antivirus software and sandboxing.
This research paper highlights the limitations of reactive security approaches and makes the case for a proactive solution. It introduces Glasswall’s Content Disarm and Reconstruction (CDR) technology, which neutralizes threats at the file level, including those hidden in QR codes, by rebuilding documents to a safe and clean standard.
With QR code-based attacks on the rise, organizations must shift from detection to prevention. Glasswall CDR offers a reliable, scalable way to eliminate hidden threats while preserving document fidelity, helping enterprises and governments to protect sensitive data and maintain trust in digital interactions.
Introduction
How QR codes are used by threat actors
QR codes are a novel attack vector used by threat actors to persecute targets. QR codes enable threat actors to prompt staff to access malicious domains, which enables initial access via browser exploitation or extraction of a user’s credentials[1].
Hypothetical attacks
Hypothetically, QR codes can be used for on-device exploitation, provided there is a vulnerability in the parser/decompressor on the user’s device for the data type in the QR codes encoded region. QR codes also facilitate the transmission of any type of data across a trust boundary: this is because of an optional feature that can be found on page sixty of the 2015 QR code standard under Section 8: Structured Append. [2] This feature enables any file of any type to be encoded in up to sixteen QR codes, which can then be scanned in any order to recover the original file. The amount of data that individual QR codes can store is still relatively small, but the extraction of cryptographic keys or other sensitive data from an estate is achievable and can do a lot of damage.
Problem Statement
Our primary objective is to detect and remove QR codes from image files. QR codes, whilst typically being clearly defined in an image, may also be occluded or blurred which needs to be accounted for. Detection and removal are a two-stage process which is:
- detection of the polygon which surrounds a QR code
- replacement of all the pixels in the polygon with black pixels
Acceptance criteria are that the technique used to detect QR codes should have a true positive rate of 99% and a false positive rate of 0.1%. The technique used should only parse structural data and not attempts content decompression or processing due to potential security concerns.
This research doesn’t deal with the detection and mitigation of micro QR codes.
QR Code ISO Standard
Relevant QR code structural data
A QR code is a square matrix of modules. A module is a square pattern made up exclusively of zeros or ones. Three unique finder patterns, detailed in image 2, are located at the upper-left, upper-right and lower-left corners of the symbol. These finder patterns enable a QR code’s position, size and inclination to be determined. An example QR code is shown in Image 1. QR codes can be reversed, in which case the lower finder pattern is placed in the lower right-hand corner of the QR code rather than the left. QR codes can be inverted, also known as reflectance reversed, where normally nominally black modules are white and vice versa.

Image 1: An example QR code.
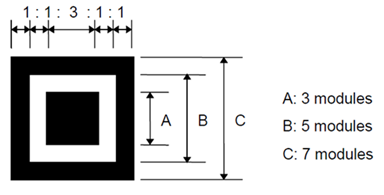
Image 2: The structure of a QR code finder pattern in a non-inverted QR code. This diagram can be found under Section 6.3.3 Finder Pattern of [2]
Each finder pattern is made up of three concentric squares/modules. The innermost module is square A, the next module is square B, and the outermost module is square C. A horizontal or vertical line through a finder pattern produces a b:w:b:w:b pattern of modules. This b:w:b:w:b pattern is used by the reference decode algorithm described in the next section to detect a QR code in an image. The ratios between each run of black and white modules in the b:w:b:w:b pattern is expected to be 1:1:3:1:1. Pixel runs, which could potentially be part of a finder pattern, should be relatively rare in scenes which don’t contain a QR code.
Reference decode algorithm
The reference decode algorithm for QR codes can be found under Section 12: Reference Decode Algorithm of the 2015 QR Code ISO Standard[2]. Relevant to this report are steps (b) and (c) of the reference decode algorithm. These are the first steps executed by the algorithm to find the locations of QR codes and two other finder patterns once one has been found. A polygon which surrounds the code can be found once the finder patterns have all been located by using them as corner locations. The polygon which surrounds the code can be used to specify where in the image to overwrite the QR code with black pixels.
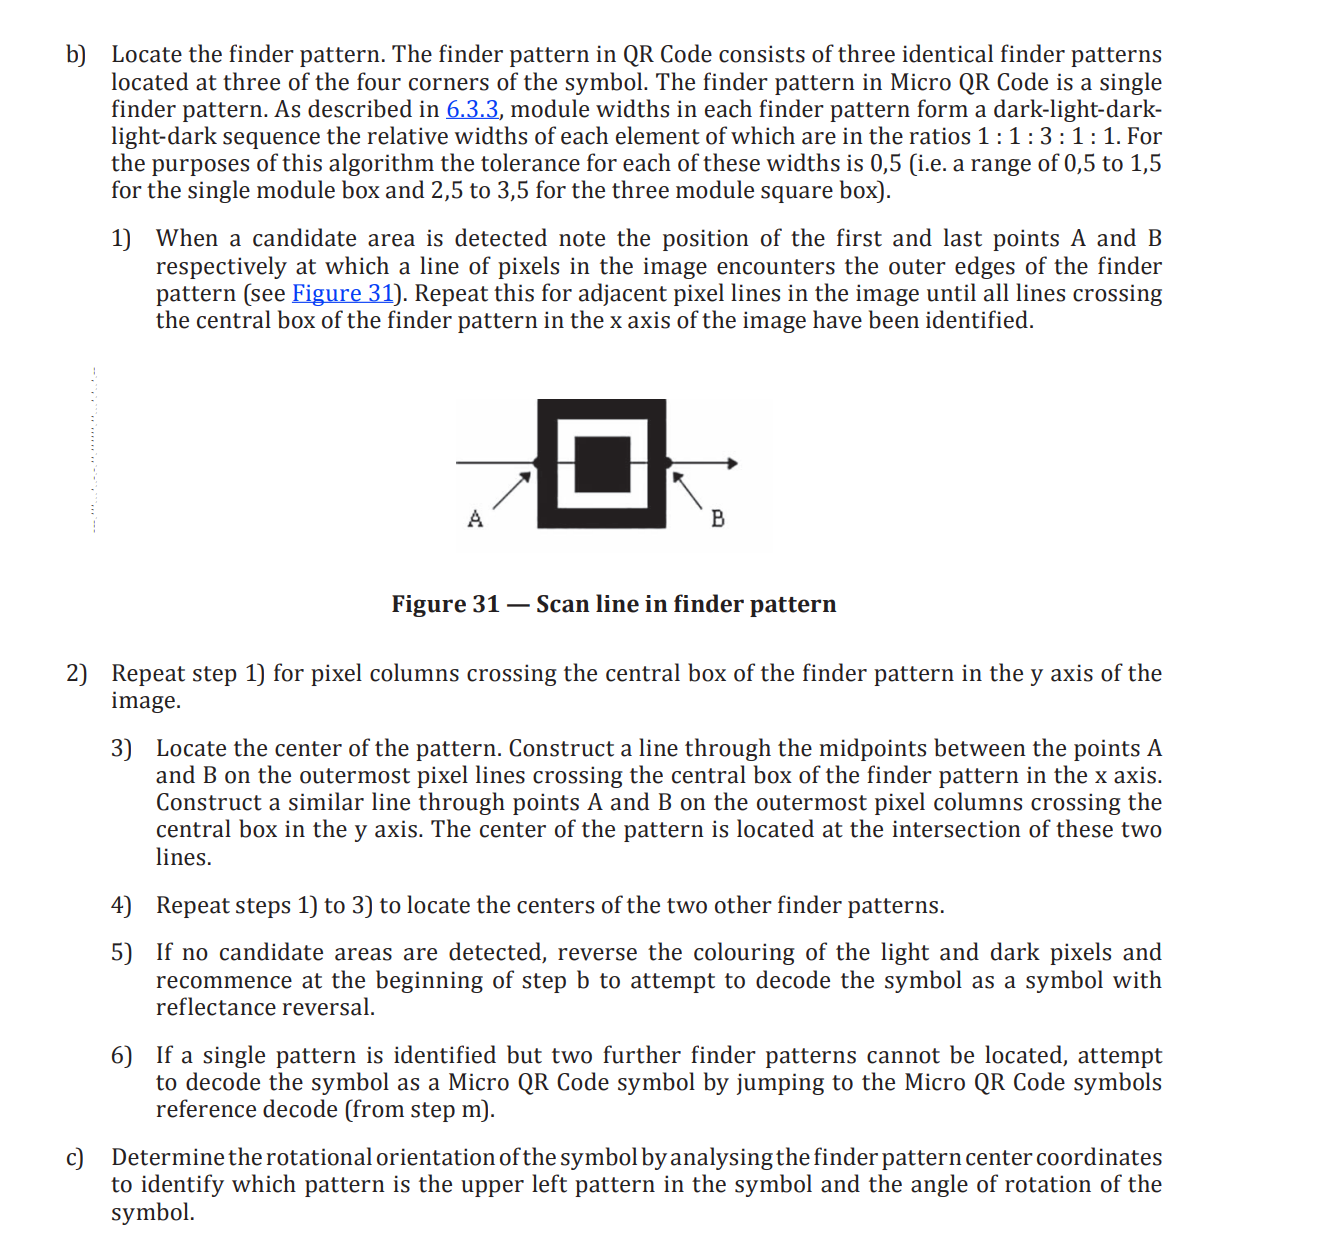
Image 3: Steps (b) and (c) of the QR code reference decode algorithm. See Section 12 Reference Decode Algorithm for QR Code of [2]
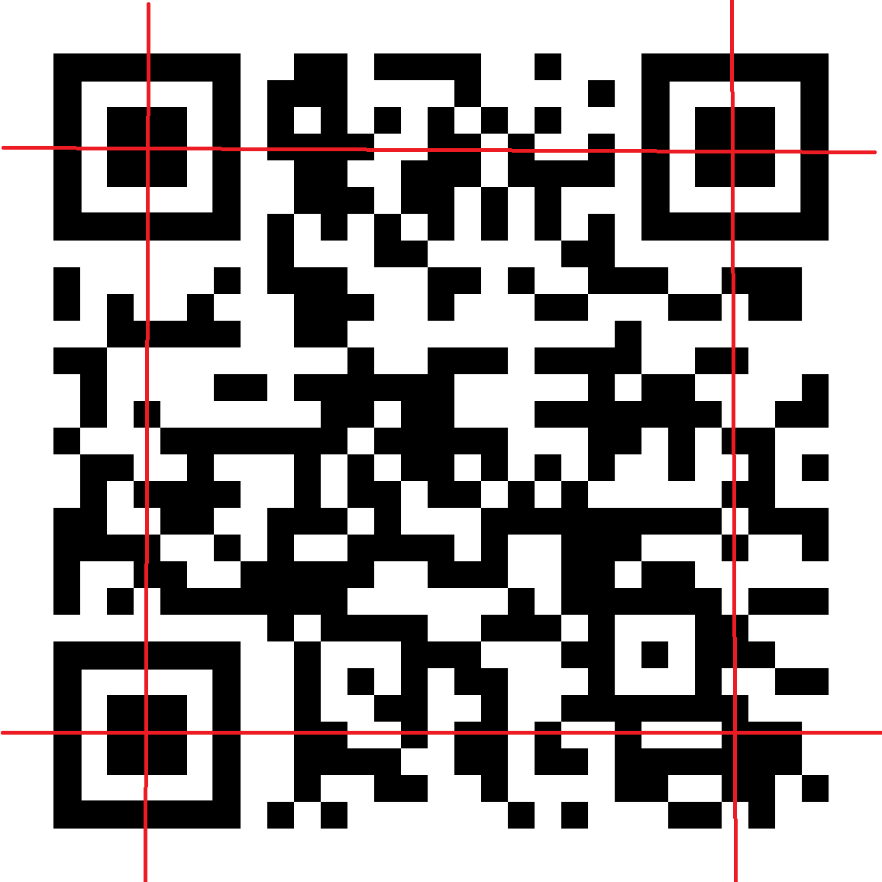
Image 4: The lines used by the QR code reference decode algorithm to locate the two other finder patterns once one finder pattern has been found.
In Image 4, the red lines are for illustrative purposes only: they don’t pass through the center of each finder pattern. These lines must be orthogonal (at right angles) for the finder patterns to be part of a standard conformant QR code.
Statistical Evaluation of QR Code Detection Methods
The test dataset is made up of images which belong to one of four categories:
- Images which don’t contain QR codes (n = 153).
- Images which only contain one manually generated QR code (n = 97)
- Real-world scenes which contain one or more detectable QR codes (n = 32).
- Real-world scenes which contain occluded or blurred QR codes (n = 24).
There are 153 images which don’t contain QR codes and 153 which do.
The dataset is unbalanced e.g. the portion of the test dataset which contains QR codes is made up of multiple categories which are not the same size, some categories contain images which have a much higher resolution than others, etc. This will affect the explanatory power of the statistics in this report. I’m not qualified to comment on how the lack of balance will affect the statistics.
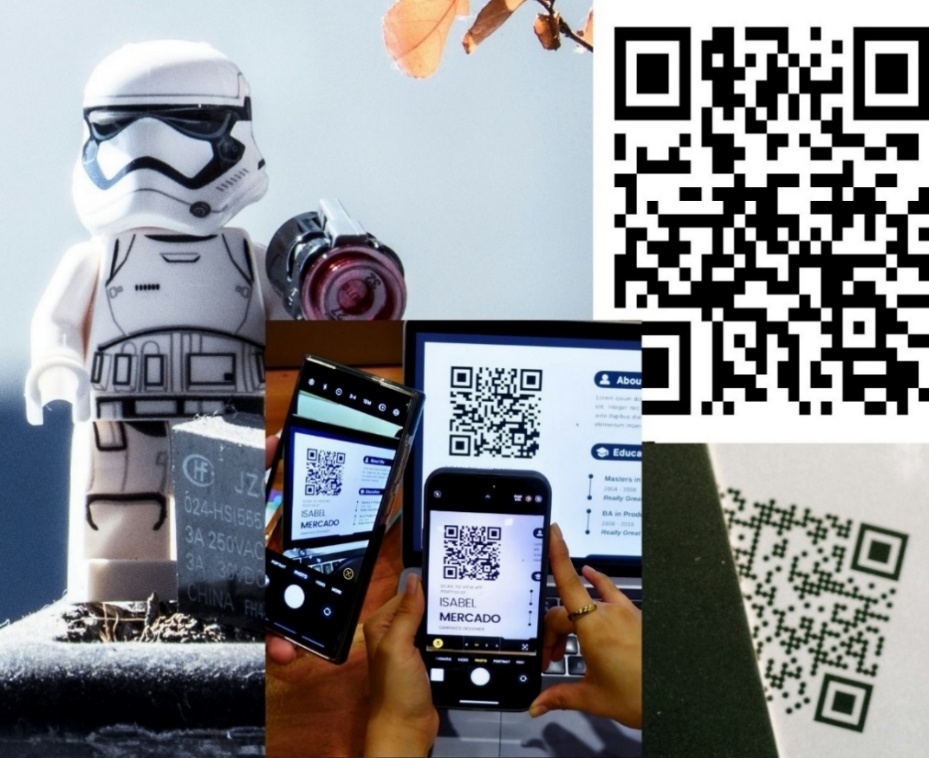
Image 5: An example image from each category in the test dataset.
All the images which are not manually generated QR codes were saved from Unsplashed[3], which provides copyright free images. QR codes are determined to be recognisable if an iPhone SE 2nd Ed which runs iOS 18.2.1 can detect and decode any QR codes in the image using the Camera app. As such, the Camera app served as the ground truth for whether an image contains a readable QR code. The Camera app uses industry-standard technology to detect QR codes in images and emulates the expected behaviour of QR code recipients. The frameworks used to write the Camera app implement state-of-the-art algorithms: if the Camera app can’t detect a QR code, then it’s unlikely any detector can.
Four well-known QR code detection libraries were run over the test dataset: Quirc, Pyzbar, QRDet and the WeChat QR code detector.
| Detection Method | Accuracy (2 d.p.) | Sensitivity (2 d.p.) | Specificity (3 d.p.) |
|---|---|---|---|
Pyzbar | 0.82 | 0.66 | 0.980 |
QRDet | 0.91 | 0.84 | 0.987 |
Quirc | 0.84 | 0.68 | 1 |
0.91 | 0.66 | 1 |
The error matrices are shown below.
| Quirc | |||
|---|---|---|---|
N = 306 | Predicted | ||
Actual | QR Code | No QR Code | |
QR code | 104 | 49 | |
No QR code | 0 | 153 | |
Table 2: The error matrix of Quirc when it’s run over the test dataset.
| Pyzbar | |||
|---|---|---|---|
N = 306 | Predicted | ||
Actual | QR Code | No QR Code | |
QR code | 101 | 52 | |
No QR code | 3 | 150 | |
Table 3: The error matrix of Pyzbar when it’s run over the test dataset.
At a confidence level of 0.85:
| QRDet (YOLO8) | |||
|---|---|---|---|
N = 306 | Predicted | ||
Actual | QR Code | No QR Code | |
QR code | 128 | 25 | |
No QR code | 2 | 151 | |
Table 4: The error matrix of QRDet when it’s run over the test dataset.
| WeChat QR code detector | |||
|---|---|---|---|
N = 306 | Predicted | ||
Actual | QR Code | No QR Code | |
QR code | 102 | 51 | |
No QR code | 0 | 153 | |
Table 5: The error matrix of the WeChat QR code detector when it’s run over the test dataset.
The WeChat QR code detector’s inference speed was much slower than that of YOLO, the ML model which underpins QRDet. The QRDet test ran in less than ten minutes. The test using the WeChat QR code detector had to be run in excess of eight hours.
Detection of generated QR codes only
A subset of the test dataset made up of images which belong to one of two categories:
- Images which don’t contain QR codes (n = 97).
- Images which only contain one manually generated QR code (n = 97)
Was used to evaluate how well Quirc and Pyzbar perform on generated QR codes only. If we want to detect QR codes in a non-adversarial scenario, where we only try to detect and clean generated QR codes, it’s preferable to use a near real-time, deterministic detector which is easy to inspect.
| Detection Method | Accuracy (2 d.p.) | Sensitivity (2 d.p.) | Specificity (3 d.p.) |
|---|---|---|---|
Pyzbar | 0.99 | 0.99 | 1 |
Quirc | 1 | 1 | 1 |
Table 6: The accuracy, sensitivity, and specificity of Quirc and Pyzbar when tested against generated QR codes only.
Even though it uses a more sophisticated approach to scanning an image for potential QR codes, Pyzbar performs worse than Quirc. The cause of this decreased accuracy is yet to be determined.
| Quirc | |||
|---|---|---|---|
N = 194 | Predicted | ||
Actual | QR Code | No QR Code | |
QR code | 97 | 0 | |
No QR code | 0 | 97 | |
Table 7: The error matrix of Quirc when tested against generated QR codes only.
| Pyzbar | |||
|---|---|---|---|
N = 194 | Predicted | ||
Actual | QR Code | No QR Code | |
QR code | 97 | 0 | |
No QR code | 1 | 96 | |
Table 8: The error matrix of Pyzbar when tested against generated QR codes only.
Mitigation
Once the polygon which bounds a QR code has been found, removal of the QR code from the image using OpenCV can be done with one function call in Python:

Image 6: How to call cv2.polyFill to destroy a QR code
The cv2.fillPoly function accepts a polygon as an argument. The polygon is passed into cv2.fillPoly as a list of vertex coordinates where each vertex is a list which contains an x and a y value. Each pixel in the polygon is overwritten with a pixel of the colour of the color argument. In this case each pixel is replaced with a black pixel, as the RGB value for a black pixel is (0, 0, 0). The image argument in the call to cv2.fillPoly is a NumPy representation of the original image in raw pixel format.
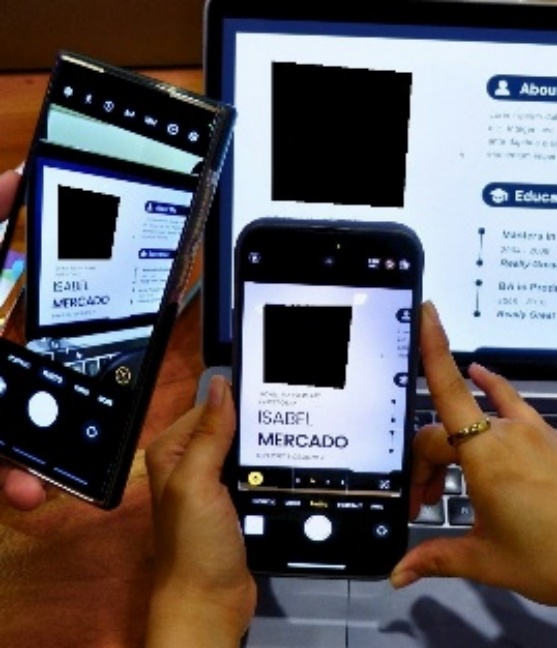
Image 7: A cleaned image where multiple QR codes have been overwritten with black pixels.
Conclusion
When dealing with adversarial use-cases of QR code use, it is not recommended to use Quirc, Pyzbar or related QR code detectors which rely on simple approaches to object segmentation. Such approaches struggle with simple, reversible transformations that cause a QR code not to be detected even when it’s standard conformant and recognizable by other detectors. It would be easy for an adversary to bypass these detection methods. An example of how this can be achieved is shown in the Appendix: “How use of Otsu’s Method Impacts QR Code Detection” section of this report. The accuracy of Quirc and Pyzbar over the full test dataset, 0.84 and 0.82, respectively, is worse than QRDet and below what we considered the acceptance criteria.
Both QRDet and the WeChat QR code detector use a convolutional neural network (CNN), a type of ML model, to detect QR codes in an image. CNNs are state-of-the-art in computer vision. ML models are deployed widely and effectively across the commercial space to detect QR codes e.g. Google’s QR Code detection API uses ML to detect QR codes in an image. [4] Because of this we recommend deploying an ML-based solution for the adversarial actor use-case. The performance of QRDet compared to Quirc and Pyzbar on the full test dataset shows the advantages of this approach. QRDet is more sensitive than the WeChat detector but less specific, see Table 1, which means that QRDet is more likely to detect a QR code in an image than the WeChat detector, but it’s also more likely to detect a QR code in an image which doesn’t contain a QR code and generate a false positive or remove non-QR image content.
On generated QR codes, Quirc marginally outperforms Pyzbar, however even though Quirc detects QR codes in all the images which contain generated QR codes, the returned polygons do not always correctly bind some QR codes. More research is needed to understand why this is the case. Although the polygon returned in these cases does not cover all the QR code, enough of the QR code is covered by the polygon that mitigation would still be effective. The polygons returned by Pyzbar correctly bound every generated QR code, however on the full dataset Pyzbar returns three false positives whereas Quirc returns none.
We would therefore recommend the use of Quirc. Implementation should use a more sophisticated algorithm to threshold the input image as the use of Otsu’s method, which is used by Quirc to threshold an input image, can have a detrimental effect on QR code detection. See the Appendix: ”How Otsu’s Method impacts QR code detection” section of this report to understand why this is the case.
References
[1] | Microsoft, “Hunting for QR code AiTm Phishing and User Compromise,” Microsoft, 12 February 2024. [Online]. Available: https://techcommunity.microsoft.com/blog/microsoftsecurityexperts/hunting-for-qr-code-aitm-phishing-and-user-compromise/4053324. [Accessed 03 February 2025]. |
[2] | ISO, “ISO/IEC 18004:2015(E) Information Technology – Automatic identification and data capture techniques – QR Code barcode symbology specification,” ISO, 2015. |
[3] | Various, “Unsplash. The internet's source for visuals. Powered by creators everywhere.,” Unsplash, [Online]. Available: https://unsplash.com/. [Accessed 03 February 2025]. |
[4] | Google, “Barcode Scanning,” Google, 21 January 2025. [Online]. Available: https://developers.google.com/ml-kit/vision/barcode-scanning. [Accessed 03 February 2025]. |
Appendix
How does the use of Otsu’s method affect QR Code detection?
The image intensity histogram of an image is a graph which shows the number of pixels in an image which take a given pixel intensity value. In RGB images, each channel has its own intensity histogram:
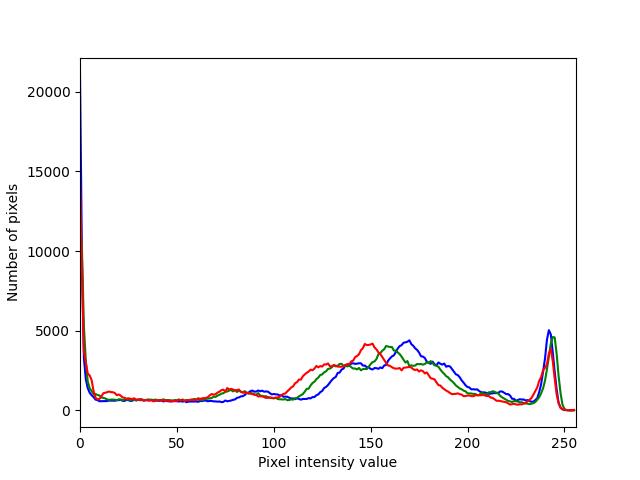
Image 8: The image intensity histograms of the red, green and blue channels of Image 9.
A binary threshold is a pixel value used to transform an image into a binary image, i.e. an image where each pixel is zero or one. To transform an image into a binary image given a threshold value, all the pixels with a value strictly less than the threshold are set to zero. All other pixels are set to one. Pixels which are zero are said to be part of the background of the thresholded image. Pixels which are one are said to belong to the foreground of the thresholded image. A threshold is typically computed by an algorithm, which can be global or local. Global algorithms derive a threshold from the properties of an image’s intensity histogram. Local algorithms use the properties of a region of an image to derive a threshold for that region only.
Global algorithms often don’t work well when used to process complex scenes, such as scenes where light causes part of an object to appear to be in both the foreground and the background of the image because of the different pixel intensity values across the object. In contrast, local algorithms perform better when run over complex scenes but are computationally expensive, so they don’t tend to be used when performance needs to be near-real or real-time. For systems which need to have a high throughput the choice between using a global or local algorithm will depend on the amount of compute available.
Otsu’s method is an automatic global thresholding algorithm that operates on grayscale images. Otsu’s method iterates through all possible threshold values: 0 to 255. For each threshold, the intra-class variance of the background and foreground classes is recorded. Once all possible thresholds have been tried, the threshold that minimizes the intra-class variance of the two classes is returned. The intra-class variance of a class is a descriptive statistic which quantifies how well members of a class resemble each other. Minimization of the intra-class variance of the background and foreground classes is useful when an image’s intensity histogram is bimodal, as this ensures that the foreground and background classes will cluster around the two modes. Advanced versions of Otsu’s method exist, which can deal with some noise in the image.
A connected component is a set of adjacent pixels which are the same colour. An example of a connected component in Image 9 is square C of the upper-right finder pattern. Connected component analysis is important in classical approaches to QR code detection because it allows simple tests to be performed to see if a run of pixels belongs to a finder pattern e.g. in a run of pixels which follow the 1:1:3:1:1 pattern, which defines a finder pattern row or column if the black pixels all belong to the same connected component then the run of pixels cannot be part of a QR code finder pattern.
Most non-proprietary QR code detectors use a standard computer vision pipeline to pre-process an image before the reference decode algorithm is run over the image. The reference decode algorithm described in Section 12 of [2] is used to locate and decode QR codes in an image; steps (b) and (c) of the algorithm are reproduced in Image 3. Steps (b) and (c) are used to locate a QR code in an image.
A common approach is to use Otsu’s method to transform a grayscale image into a binary image, after which connected component analysis or edge detection is used to emphasize potential finder patterns in the image. The use of Otsu’s method to threshold an image can be problematic, as Otsu’s method performs very poorly when used to threshold more complex scenes (both Quirc and Pyzbar use Otsu’s method). This often disrupts connected component analysis, which in turn disrupts QR code detection.
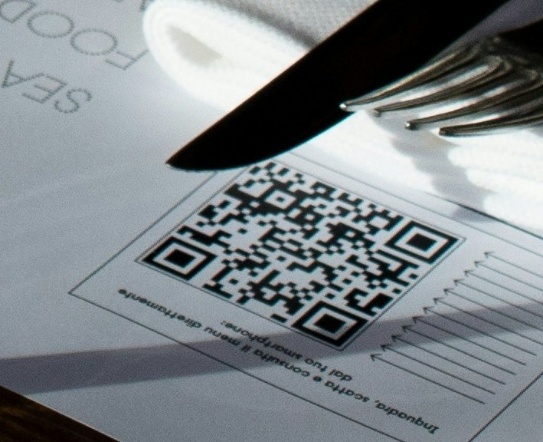
Image 9: A QR code where the upper-left finder pattern is partly covered by a shadow.
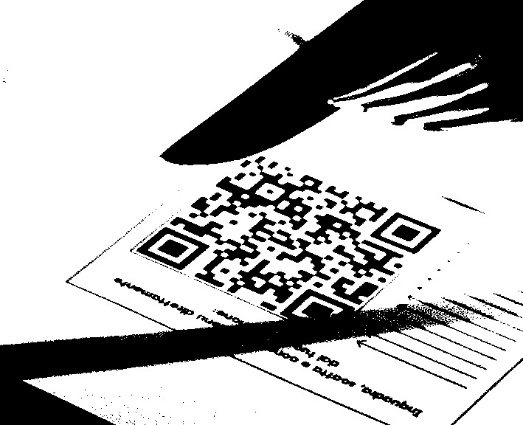
Image 10: Otsu’s method produces a poorly binarized image when used to threshold Image 9.
The shadow in Image 9 has caused part of the upper-left finder pattern to be classified as part of the foreground in Image 10. This means that the finder pattern is no longer standard conformant.
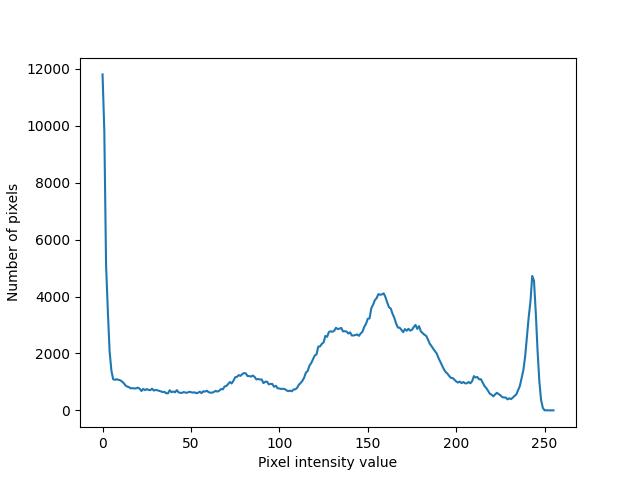
Image 11: The grayscale image intensity histogram of Image 9.
The image intensity histogram of Image 9 - see Image 11 - is not bimodal. This breaks the key assumption of Otsu’s method. How should pixels clustered around one of the three modes be clustered around the other two? If pixels around the mode are not clustered exclusively around one of the other modes, then pixels associated with the mode will be assigned to both the foreground and the background, which leads to poor binarization. If they are clustered around only one of the other modes, this forces pixels which may belong to both the background and the foreground to be assigned to one class. This removes important details:
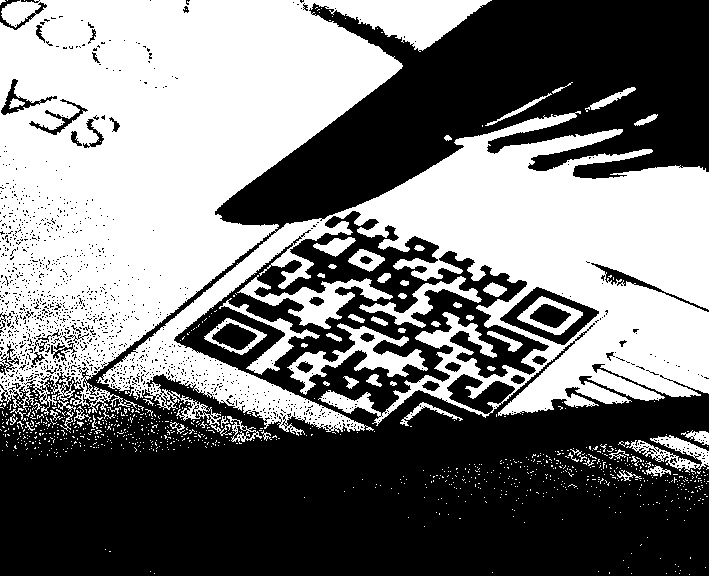
Image 14: Image 9 thresholded with a pixel intensity value of 150.
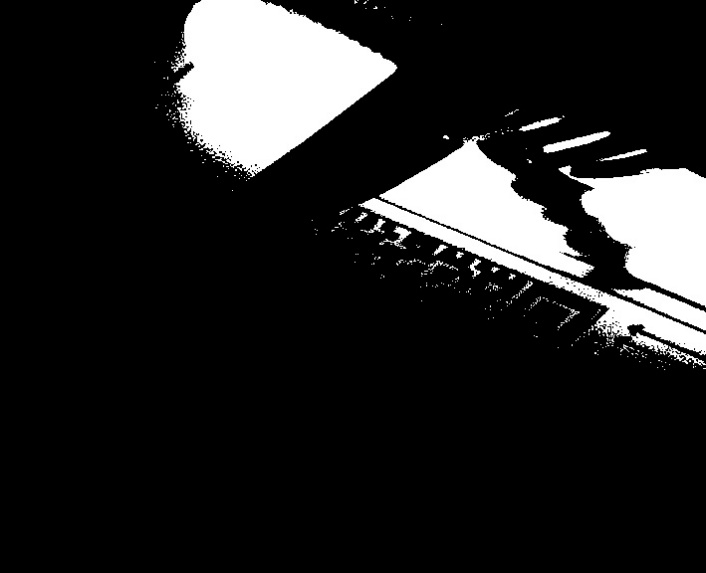
Image 15: Image 9 thresholded with a pixel intensity value of 200.
In both cases, the binarization isn’t ideal.
Other algorithms often find better thresholds:
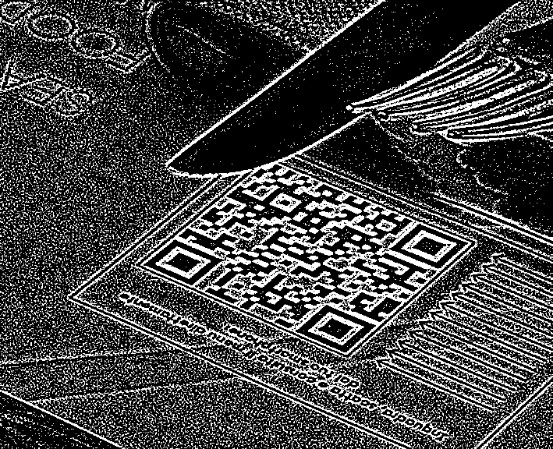
Image 16: A binary image produced by the application of a normalized 3x3 box filter and Gaussian Adaptive thresholding to Image 9, where the block size is 3 and C = 0.
In Image 16 the upper-left finder pattern is much better preserved when compared to Image 10. This is a good example of how local methods can outperform global methods on more complex scenes, and how other methods outperform Otsu’s method when it comes to preservation of a QR code’s key features, such as the codes finder patterns.
Example false positives
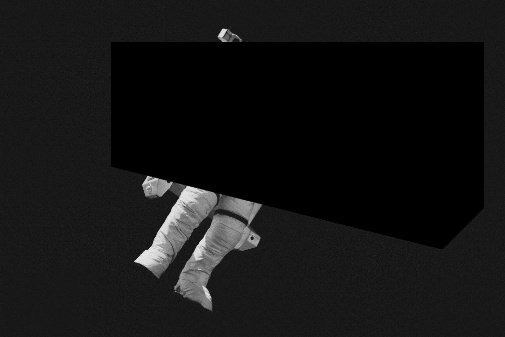
Image 17: A false positive returned by Pyzbar.
It is currently unclear why the polygon in Image 17 has five sides when it should only have four. This oddity has been noted for further investigation in future work.
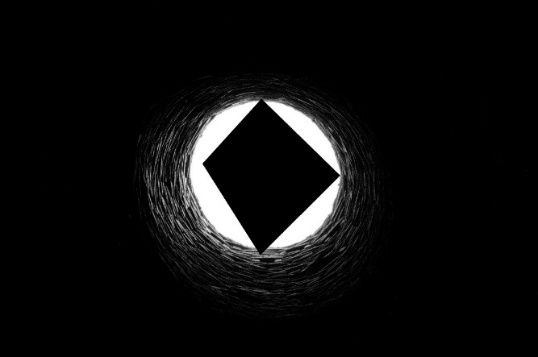
Image 18: A false positive returned by QRDet.